
User Guide
ResearchPLS: A Comprehensive Guide to Statistical Modeling and Analysis
Version 0.1.0 · Last updated 2026
Abstract
ResearchPLS is a desktop application for variance-based and covariance-based structural equation modeling, alongside standalone regression and component-based methods, built for researchers who require a transparent, reproducible analytical workflow from raw data to a publication-ready report. This guide documents every analytical capability the application provides -- data preparation, visual model specification, estimation (PLS-SEM, consistent PLS-SEM, CB-SEM, and GSCA), measurement and structural model assessment, statistical inference via bootstrapping, and the full set of advanced techniques available from the Calculate menu (mediation, moderation, multi-group analysis, unobserved heterogeneity, predictive assessment, importance-performance mapping, and necessary condition analysis). Each procedure is presented alongside the methodological literature it implements, cited in APA (7th ed.) style, so that a reader can trace every threshold and formula this guide states back to its original source rather than take it on faith.
1. Introduction
Partial least squares structural equation modeling (PLS-SEM) has become a standard multivariate technique across the social and management sciences for estimating complex networks of relationships among latent (unobserved) and observed variables, particularly when a study is oriented toward prediction and theory development rather than confirmation of a strictly specified covariance structure (Hair et al., 2022). ResearchPLS implements PLS-SEM as its primary estimation method, alongside covariance-based SEM (CB-SEM) for confirmatory work, generalized structured component analysis (GSCA; Hwang & Takane, 2004) as a component-based alternative, and standalone linear/logistic regression for research questions that do not require a full structural model.
A typical project in ResearchPLS follows one path, corresponding to the sections of this guide: import a dataset, prepare and review it, specify a model on the visual canvas, estimate it, assess the measurement and structural model against established quality criteria, run whichever advanced techniques the research question calls for, and export a report. Every numeric result the application displays is the direct, unedited output of the statistical engine that produced it -- ResearchPLS does not fabricate, round-trip, or otherwise alter a computed value before display, and honestly reports a metric as unavailable rather than approximating it when the underlying computation does not apply.
2. Getting Started
ResearchPLS ships as a native Windows desktop application with the statistical engine bundled inside the installer -- no separate Python or R installation is required. On first launch, a 7-day trial begins with just an email address, giving access to the core workflow (data import, model building, and the base PLS-SEM algorithm) before any purchase decision. The trial entitlement is tracked by the license server against the account rather than anything stored locally, so reinstalling the application does not reset it. See the Download page for system requirements and the installer itself.

3. Data Management
A project accepts CSV, Excel (.xlsx), and plain-text delimited files; column types (numeric or text) are inferred automatically on import and shown in the dataset editor for review before any indicator is assigned to a construct. For confirmatory work where only summary statistics are available -- a common situation when re-analyzing results reported in a published paper -- ResearchPLS also accepts a pre-computed covariance or correlation matrix directly, together with the real sample size it was computed from, since a covariance matrix alone carries no information about degrees of freedom.
Before model specification, two checks matter most. First, missing values and near-zero-variance columns should be resolved or excluded, since PLS-SEM's iterative algorithm requires complete case-level data. Second, the sample size should be adequate for the model's complexity -- see Section 23 (Sample Size and Statistical Power) for how ResearchPLS computes the minimum sample a given specification realistically needs, following the statistical-power logic in Cohen (1988).

4. Model Specification
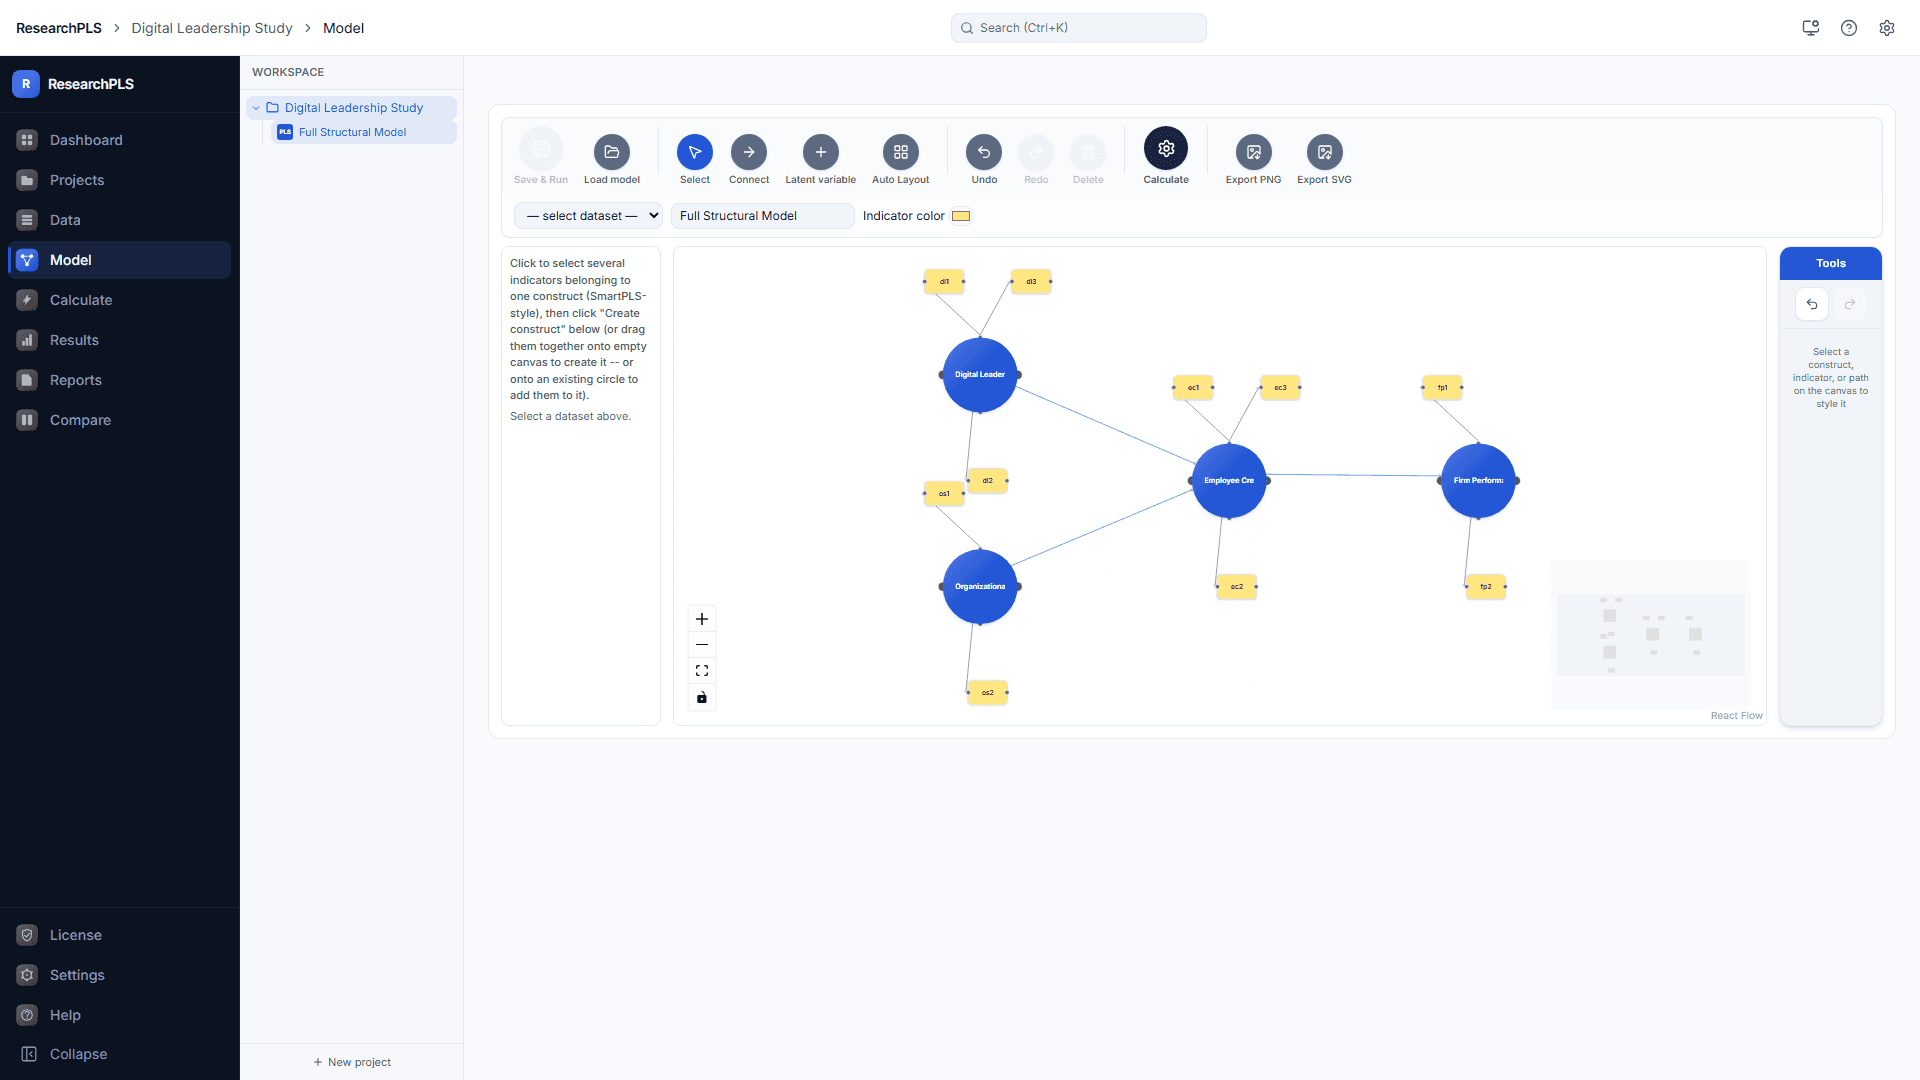
The Model Builder is a visual, drag-and-drop canvas. Each construct is added as a node, indicators from the imported dataset are assigned to it, and the construct is marked as reflective (Mode A) or formative (Mode B) before structural paths are drawn between constructs. This distinction is not cosmetic: a reflective (Mode A) construct is modeled as the common cause of its indicators, and its quality is assessed through internal-consistency reliability and convergent/discriminant validity (Section 10), whereas a formative (Mode B) construct is modeled as being formed by its indicators, and is instead validated through indicator weights, collinearity among indicators, and convergent validity against a global, reflectively-measured proxy of the same construct via redundancy analysis (Cheah et al., 2018).
The inner (structural-model) weighting scheme -- path, centroid, or factor -- can be set per model; path weighting is the default and the most common choice in applied PLS-SEM research, distinguishing exogenous and endogenous relationships directly, whereas the centroid and factor schemes were the original weighting approaches proposed by Chin (1998) and are retained primarily for consistency with legacy analyses.
5. Higher-Order Constructs
A higher-order construct (HOC) represents a more abstract concept through a set of lower-order components, each of which is itself a construct with its own indicators -- useful when a theoretical concept (e.g., overall service quality) is more naturally understood as composed of several narrower dimensions than as one directly-indicated construct. ResearchPLS supports both established specification approaches: the repeated-indicators approach, in which the higher-order construct is directly assigned every indicator of its lower-order components, and the two-stage approach, in which the lower-order components are estimated first and their latent variable scores are then used as the higher-order construct's own indicators in a second estimation pass (Becker et al., 2012; Sarstedt et al., 2019). Reliability and validity for a higher-order construct must be assessed on the higher-order level itself, not inferred from its components in isolation -- a distinction Sarstedt et al. (2019) show is frequently mishandled in applied research.
6. The PLS-SEM Algorithm
With a model specified and a dataset attached, the PLS-SEM Algorithm run (Calculate menu) estimates outer weights, loadings, path coefficients, and R² through PLS's iterative alternating least-squares procedure -- available in the free trial as the application's base estimation method. Convergence is reported after every run: the number of iterations taken and whether the algorithm converged within its configured tolerance. A model that fails to converge almost always indicates a specification issue (too few indicators on a construct, near-perfect collinearity between indicators, or a sample too small for the model's complexity) worth revisiting in the Model Builder rather than a fault in the estimation itself.
7. Consistent PLS-SEM (PLSc)
Ordinary PLS-SEM produces parameter estimates for reflectively-measured constructs that are, by construction, attenuated relative to their true population values -- a known consequence of estimating construct scores as weighted composites rather than as latent factors. Dijkstra and Henseler (2015) introduced consistent PLS (PLSc), a correction that adjusts loadings, path coefficients, and inter-construct correlations for this attenuation, bringing PLS estimates much closer to those of maximum-likelihood CB-SEM under comparable conditions, and introduced the rho_A reliability coefficient as part of the same correction. ResearchPLS supports Consistent PLS-SEM Bootstrapping directly from the Calculate menu -- the correction and the resampling-based inference of Section 12 applied together in one run, so a researcher who needs both consistency-corrected estimates and their standard errors/confidence intervals does not have to reconcile two separate analyses by hand.
8. Confirmatory Factor Analysis and CB-SEM
Where a research question calls for confirmatory, covariance-fitting estimation rather than PLS's prediction-oriented, variance-based approach, ResearchPLS also estimates the model as a covariance-based SEM (CB-SEM) via maximum likelihood, reporting the standard fit indices (e.g., chi-square, CFI, RMSEA) alongside path estimates. Hair et al. (2018) discuss the practical decision between PLS-SEM and CB-SEM at length: CB-SEM is the appropriate choice when the object of the study is confirming a well-established theory against a strict covariance structure, whereas PLS-SEM is preferable for exploratory, prediction-oriented research, models with formatively-measured constructs, or smaller and less normally distributed samples. ResearchPLS deliberately supports both rather than forcing one estimator onto every research design.
9. Generalized Structured Component Analysis
Generalized structured component analysis (GSCA; Hwang & Takane, 2004) is a second component-based alternative to PLS, estimating construct scores as exact linear combinations of their indicators under a single, well-defined global least-squares criterion, rather than PLS's own iterative, locally-defined weighting procedure. In practice this gives GSCA a single global optimization criterion (useful for certain model-comparison purposes) at the cost of losing PLS's specific handling of formative measurement in some specifications -- ResearchPLS exposes GSCA as an alternative estimator from the Dashboard's analysis shortcuts for researchers who specifically need this property, not as a replacement for PLS-SEM.
10. Measurement Model Assessment
For reflective (Mode A) constructs, ResearchPLS reports internal-consistency reliability via Cronbach's alpha (Cronbach, 1951), composite reliability, and Dijkstra and Henseler's (2015) rho_A, since each coefficient carries different, well-documented assumptions and no single one is universally preferred in the current literature. Convergent validity is assessed via the average variance extracted (AVE), following Fornell and Larcker (1981), with the conventional benchmark that AVE should exceed 0.50 -- meaning the construct explains more variance in its indicators than measurement error does.
Discriminant validity -- whether a construct is empirically distinct from every other construct in the model -- is reported two ways: the original Fornell-Larcker criterion (comparing the square root of each construct's AVE against its correlations with other constructs; Fornell & Larcker, 1981) and the heterotrait-monotrait ratio of correlations (HTMT), which Henseler et al. (2015) demonstrated via Monte Carlo simulation detects a genuine lack of discriminant validity far more reliably than the Fornell-Larcker criterion or cross-loadings inspection in common research conditions. For formatively-measured (Mode B) constructs, convergent validity is instead assessed via redundancy analysis against a reflectively-measured global item for the same construct, per Cheah et al. (2018).
11. Structural Model Assessment
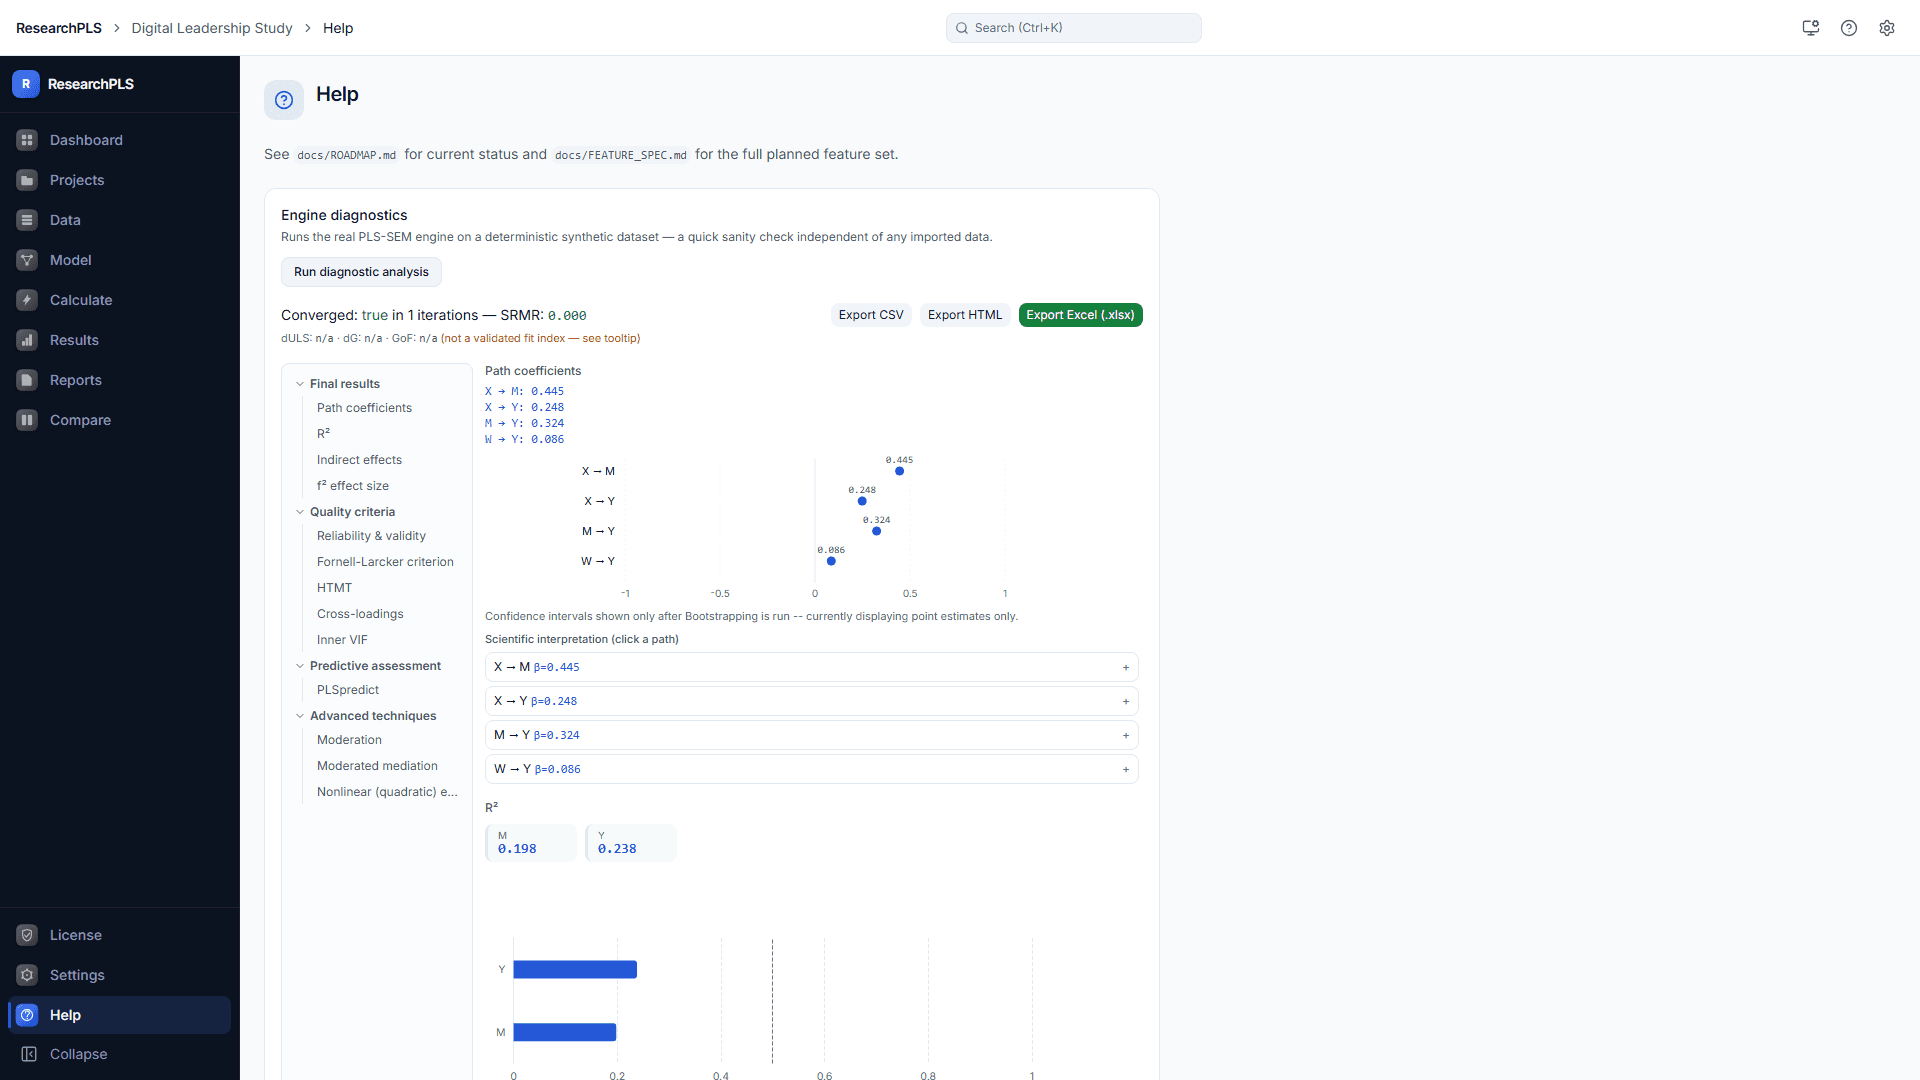
Structural model assessment begins with collinearity: ResearchPLS reports the inner VIF for every predictor construct, and a full collinearity test across the entire model, following Kock's (2015) demonstration that full collinearity assessment can surface common method bias even in models that otherwise pass conventional convergent and discriminant validity checks. R² and adjusted R² report the variance explained in each endogenous construct; Cohen's f² (Cohen, 1988) reports each predictor's own individual contribution to that R² by comparing the model with and without it, at the conventional 0.02/0.15/0.35 small/medium/large benchmarks.
Path coefficient significance on its own requires bootstrapping (Section 12) -- a single-sample PLS-SEM run produces point estimates with no standard error, so significance cannot be judged from the base algorithm run alone.
12. Bootstrapping and Statistical Inference
Bootstrapping resamples the dataset with replacement a configurable number of times (1,000, 2,000, 5,000, or 10,000), re-estimating the entire model on every resample to build an empirical sampling distribution for every coefficient the model produces -- the standard approach to inference in PLS-SEM, since the technique makes no distributional assumption that would otherwise license a parametric standard error (Hair et al., 2022). Results include standard errors, t-values, p-values, and confidence intervals for path coefficients, indirect effects, and outer loadings/weights. A fixed random seed can be set so that a bootstrap run is exactly reproducible later -- an important property when a result is being prepared for peer review.
13. Predictive Assessment
Beyond in-sample fit, ResearchPLS supports three complementary out-of-sample assessment procedures. Blindfolding computes the Stone-Geisser Q² (Geisser, 1974; Stone, 1974) via a blindfolding (omission-and-prediction) procedure -- a Q² above zero for an endogenous construct indicates the model has real predictive relevance for it, beyond simply fitting the estimation sample. PLSpredict (Shmueli et al., 2016) extends this into a genuine holdout-sample procedure, generating case-level, indicator-level out-of-sample predictions and comparing the model's prediction error against a naive linear benchmark -- a model that loses to the naive benchmark on a meaningful share of indicators has real, diagnosable predictive weaknesses despite what its in-sample R² might suggest. The Cross-Validated Predictive Ability Test (CVPAT; Liengaard et al., 2021) goes one step further, providing a formal statistical test for comparing the predictive performance of two competing model specifications rather than reading PLSpredict's comparison informally. Where the research question is choosing among several competing in-sample specifications rather than comparing predictive performance directly,ResearchPLS also reports information-theoretic model-selection criteria following Sharma et al. (2021).
14. Mediation Analysis
Mediation analysis estimates the indirect effect of a predictor on an outcome through one or more mediating constructs, alongside the direct and total effects, using the bootstrap confidence interval on the indirect effect to judge significance -- an interval that excludes zero is considered statistically supported evidence of mediation at that confidence level, following the resampling logic Preacher and Hayes (2008) established as the modern standard over the older, lower-powered causal-steps approach. Nitzl et al. (2016) set out the specific procedural guidelines ResearchPLSfollows for applying this logic correctly within a PLS-SEM path model, including how to characterize a supported indirect effect as complementary or competitive partial mediation, or full mediation, based on whether the corresponding direct effect remains significant and the sign of the two effects.
15. Moderation and Moderated Mediation
Moderation analysis tests whether the strength or direction of a path between two constructs depends on a third, moderating variable, via an interaction term; ResearchPLS reports the interaction effect's own significance directly and can compute simple slopes at representative levels of the moderator (typically ±1 SD and the mean) to show the conditional relationship concretely, per the guidelines in Hair et al. (2018). Moderated mediation (conditional process analysis) combines Sections 14 and 15 for models where the strength of an indirect effect itself depends on a moderating variable -- a common and increasingly expected specification in applied structural modeling. A quadratic (nonlinear) effect of one construct on another can also be tested directly, for research questions where theory predicts a curvilinear rather than strictly linear relationship.
16. Endogeneity and the Gaussian Copula
Endogeneity -- when a predictor construct correlates with the structural model's own error term, typically because of an omitted variable, reverse causality, or measurement error -- biases path coefficient estimates in ways ordinary PLS-SEM diagnostics do not detect. Where a genuine instrumental variable is unavailable (the traditional remedy, and often infeasible in survey-based social-science research), ResearchPLS implements the Gaussian copula approach, which models the endogenous predictor's own error distribution directly and uses it to correct the structural estimates, following the systematic procedure Hult et al. (2018) set out for applying this technique within a PLS-SEM framework specifically. The application reports the corrected estimates alongside the uncorrected ones so the size and direction of the correction itself is visible, not just its endpoint.
17. Multi-Group Analysis and Measurement Invariance
Multi-group analysis (MGA) tests whether a path coefficient differs significantly between two groups (e.g., two countries, or a demographic split) -- ResearchPLS supports both the permutation-based test and a consistency-corrected variant. Critically, comparing groups on a structural path is only meaningful once the groups' underlying measures are shown to be comparable in the first place; Henseler et al. (2016) formalized this as measurement invariance of composites (MICOM), a three-step procedure (configural invariance, compositional invariance, and equality of composite mean values and variances) that ResearchPLS runs before an MGA result is reported, so a between-group difference is never presented without first establishing that the groups can legitimately be compared at all.
18. Unobserved Heterogeneity: FIMIX-PLS and PLS-POS
A single structural model estimated on a pooled, heterogeneous sample can mask real differences between unobserved subgroups within it -- a validity threat Becker et al. (2013) term unobserved heterogeneity.ResearchPLS implements two complementary detection methods. FIMIX-PLS (Hahn et al., 2002) is a finite-mixture, distribution-based approach that estimates segment membership probabilistically; the application reports the standard model-selection criteria Sarstedt et al. (2011) recommend for choosing how many segments a given dataset actually supports, rather than defaulting to an arbitrary number. PLS-POS (Becker et al., 2013) instead uses a distribution-free, hill-climbing reassignment procedure that directly optimizes each segment's own model fit. Reporting both is deliberate: Becker et al. (2013) show via simulation that the two methods have different strengths depending on the true underlying data-generating process, so a researcher benefits from seeing where they agree and where they diverge on the same dataset.
19. Importance-Performance Map Analysis
Importance-performance map analysis (IPMA) extends the structural model's own path coefficients -- the "importance" dimension -- with each construct's and indicator's own rescaled average value, the "performance" dimension, following Ringle and Sarstedt (2016). Plotting both together identifies which predictors combine high importance to a target construct with comparatively low current performance -- exactly the predictors a manager or policymaker should prioritize improving first, a conclusion the path coefficients alone cannot support, since a highly important predictor that already performs well needs no intervention.
20. Necessary Condition Analysis
Necessary condition analysis (NCA) answers a logically distinct question from PLS-SEM's own sufficiency-oriented path estimates: not "how much does X contribute to Y, on average," but "is a given level of X a necessary -- though not on its own sufficient -- condition for a given level of Y." Dul (2016) formalized NCA's ceiling-line logic (drawn along the upper edge of the X-Y scatter rather than through its center, as ordinary regression does) and its effect-size measure. ResearchPLSreports the ceiling envelope, the necessity effect size, and a permutation-based significance test for each predictor a researcher specifies, as a genuinely separate analysis from the structural model rather than a variant path-coefficient reading.
21. Standalone Regression and Logistic Regression
Regression is available independent of the SEM model builder, for research questions that are a direct predictor-outcome relationship rather than a full structural model. Multiple linear regression reports unstandardized and standardized coefficients, R² and adjusted R², VIF for multicollinearity, and a full ANOVA table; logistic regression reports coefficients, odds ratios, and McFadden's pseudo-R² for binary outcomes, alongside the diagnostic plots (ROC curve, confusion matrix, predicted-probability distribution) needed to assess a classifier honestly rather than from the pseudo-R² alone. Both support bootstrapping for robust standard errors when the classical assumptions (normality, homoscedasticity) are in doubt.
22. Principal Component Analysis
Principal component analysis (PCA) is available as a standalone, exploratory data-reduction tool, reporting the real eigenvalues, explained-variance table, scree plot, and component loadings for a selected set of variables -- useful for exploring a dataset's underlying dimensionality before committing to a specific confirmatory measurement model, or as a preliminary check for the near-collinearity that VIF-based diagnostics elsewhere in the application also surface.
23. Sample Size and Statistical Power
Given a fitted model's real sample size, the Sample Size & Power Analysis tool reports the minimum effect size the study could realistically have detected, checked directly against every already-estimated path coefficient in the model -- built on the statistical-power framework Cohen (1988) established, and applied here to the specific structural paths a researcher has actually specified rather than a generic rule of thumb (e.g., "10 cases per indicator") disconnected from the model's real complexity.
24. Interpreting and Exporting Results
The Results view organizes every output by section -- measurement model, structural model, and each advanced analysis actually run -- with a matching chart alongside every table where a visualization adds real value, always computed from the same underlying result as its paired table. Short interpretation notes accompany each statistical threshold, explaining what a given value generally means in applied practice; where a fit index has a documented limitation in the methodological literature (for instance, the Goodness-of-Fit index's well-known inability to discriminate valid from invalid models), that caveat is shown directly beside the number rather than left implicit.
A finished analysis exports as a multi-sheet Excel workbook or a single self-contained HTML report, both including every table the analysis produced; the model diagram itself exports separately as a PNG or SVG image for direct use in a manuscript or presentation.

25. Licensing and Account Management
After purchasing on the Pricing page, activate the license key from the confirmation email under Settings > License. A ResearchPLS license covers one user on one active device at a time; deactivating the current device frees the license for a new one. Once activated, a cryptographically signed entitlement is stored and verified locally, allowing the application to keep working through a reasonable offline period without contacting the license server on every launch, while still re-verifying periodically and whenever the subscription's own status changes.
26. Conclusion
ResearchPLS brings the full span of contemporary variance-based and covariance-based structural equation modeling -- from basic PLS-SEM estimation through consistency correction, predictive assessment, multi-group invariance testing, unobserved heterogeneity detection, and necessary-condition analysis -- into one integrated, locally-run workspace, with every threshold and procedure this guide describes traceable to the peer-reviewed methodological literature it implements. Researchers are encouraged to consult the primary sources cited throughout (particularly Hair et al., 2022, as the field's standard general reference) when writing up results for publication, rather than citing this guide itself as the methodological authority.
References
Becker, J.-M., Klein, K., & Wetzels, M. (2012). Hierarchical latent variable models in PLS-SEM: Guidelines for using reflective-formative type models. Long Range Planning, 45(5–6), 359–394. https://doi.org/10.1016/j.lrp.2012.10.001
Becker, J.-M., Rai, A., Ringle, C. M., & Völckner, F. (2013). Discovering unobserved heterogeneity in structural equation models to avert validity threats. MIS Quarterly, 37(3), 665–694. https://doi.org/10.25300/MISQ/2013/37.3.01
Cheah, J.-H., Sarstedt, M., Ringle, C. M., Ramayah, T., & Ting, H. (2018). Convergent validity assessment of formatively measured constructs in PLS-SEM. International Journal of Contemporary Hospitality Management, 30(11), 3192–3210.
Chin, W. W. (1998). The partial least squares approach to structural equation modeling. In G. A. Marcoulides (Ed.), Modern methods for business research (pp. 295–336). Lawrence Erlbaum Associates.
Cohen, J. (1988). Statistical power analysis for the behavioral sciences (2nd ed.). Lawrence Erlbaum Associates.
Cronbach, L. J. (1951). Coefficient alpha and the internal structure of tests. Psychometrika, 16(3), 297–334.
Dijkstra, T. K., & Henseler, J. (2015). Consistent partial least squares path modeling. MIS Quarterly, 39(2), 297–316.
Dul, J. (2016). Necessary Condition Analysis (NCA): Logic and methodology of "necessary but not sufficient" causality. Organizational Research Methods, 19(1), 10–52.
Fornell, C., & Larcker, D. F. (1981). Evaluating structural equation models with unobservable variables and measurement error. Journal of Marketing Research, 18(1), 39–50.
Geisser, S. (1974). A predictive approach to the random effect model. Biometrika, 61(1), 101–107.
Hahn, C., Johnson, M. D., Herrmann, A., & Huber, F. (2002). Capturing customer heterogeneity using a finite mixture PLS approach. Schmalenbach Business Review, 54, 243–269.
Hair, J. F., Jr., Hult, G. T. M., Ringle, C. M., & Sarstedt, M. (2022). A primer on partial least squares structural equation modeling (PLS-SEM) (3rd ed.). Sage.
Hair, J. F., Sarstedt, M., Ringle, C. M., & Gudergan, S. P. (2018). Advanced issues in partial least squares structural equation modeling. Sage.
Henseler, J., Ringle, C. M., & Sarstedt, M. (2015). A new criterion for assessing discriminant validity in variance-based structural equation modeling. Journal of the Academy of Marketing Science, 43(1), 115–135. https://doi.org/10.1007/s11747-014-0403-8
Henseler, J., Ringle, C. M., & Sarstedt, M. (2016). Testing measurement invariance of composites using partial least squares. International Marketing Review, 33(3), 405–431.
Hult, G. T. M., Hair, J. F., Proksch, D., Sarstedt, M., Pinkwart, A., & Ringle, C. M. (2018). Addressing endogeneity in international marketing applications of partial least squares structural equation modeling. Journal of International Marketing, 26(3), 1–21.
Hwang, H., & Takane, Y. (2004). Generalized structured component analysis. Psychometrika, 69(1), 81–99.
Kock, N. (2015). Common method bias in PLS-SEM: A full collinearity assessment approach. International Journal of e-Collaboration, 11(4), 1–10. https://doi.org/10.4018/ijec.2015100101
Liengaard, B. D., Sharma, P. N., Hult, G. T. M., Jensen, M. B., Sarstedt, M., Hair, J. F., & Ringle, C. M. (2021). Prediction: Coveted, yet forsaken? Introducing a cross-validated predictive ability test in partial least squares path modeling. Decision Sciences, 52(2), 362–392.
Nitzl, C., Roldán, J. L., & Cepeda, G. (2016). Mediation analysis in partial least squares path modeling: Helping researchers discuss more sophisticated models. Industrial Management & Data Systems, 116(9), 1849–1864.
Preacher, K. J., & Hayes, A. F. (2008). Asymptotic and resampling strategies for assessing and comparing indirect effects in multiple mediator models. Behavior Research Methods, 40(3), 879–891.
Ringle, C. M., & Sarstedt, M. (2016). Gain more insight from your PLS-SEM results: The importance-performance map analysis. Industrial Management & Data Systems, 116(9), 1865–1886.
Sarstedt, M., Becker, J.-M., Ringle, C. M., & Schwaiger, M. (2011). Uncovering and treating unobserved heterogeneity with FIMIX-PLS: Which model selection criterion provides an appropriate number of segments? Schmalenbach Business Review, 63(1), 34–62.
Sarstedt, M., Hair, J. F., Cheah, J.-H., Becker, J.-M., & Ringle, C. M. (2019). How to specify, estimate, and validate higher-order constructs in PLS-SEM. Australasian Marketing Journal, 27(3), 197–211.
Sharma, P. N., Shmueli, G., Sarstedt, M., Danks, N., & Ray, S. (2021). Prediction-oriented model selection in partial least squares path modeling. Decision Sciences, 52(3), 567–607.
Shmueli, G., Ray, S., Velasquez Estrada, J. M., & Chatla, S. B. (2016). The elephant in the room: Predictive performance of PLS models. Journal of Business Research, 69(10), 4552–4564.
Stone, M. (1974). Cross-validatory choice and assessment of statistical predictions. Journal of the Royal Statistical Society: Series B, 36(2), 111–147.
Appendix A — Glossary of Key Terms
- AVE (Average Variance Extracted)
- The average share of variance a construct explains in its own indicators, relative to measurement error; the standard convergent-validity metric for reflective constructs (Fornell & Larcker, 1981).
- Bootstrapping
- A resampling procedure that re-estimates a model many times on resamples of the original data (drawn with replacement) to build an empirical distribution for a coefficient, in place of a parametric standard error.
- Endogenous construct
- A construct that receives at least one incoming structural path (i.e., is explained by another construct in the model).
- Exogenous construct
- A construct with only outgoing structural paths -- not explained by any other construct in the model.
- f² (effect size)
- Cohen's (1988) measure of one predictor construct's individual contribution to an endogenous construct's R², obtained by comparing the model with and without that predictor.
- HTMT (Heterotrait-Monotrait Ratio)
- A discriminant-validity criterion (Henseler et al., 2015) shown to outperform the Fornell-Larcker criterion and cross-loadings inspection at detecting a genuine lack of discriminant validity.
- Mode A / reflective
- A measurement specification where indicators are modeled as caused by their construct -- the construct is the common cause of its indicators.
- Mode B / formative
- A measurement specification where the construct is modeled as formed by (a composite of) its indicators, rather than causing them.
- PLSc (Consistent PLS)
- A correction (Dijkstra & Henseler, 2015) for the attenuation inherent in ordinary PLS estimates of reflectively-measured constructs, bringing them closer to CB-SEM's own estimates.
- Q² (predictive relevance)
- A measure of a model's out-of-sample predictive relevance for an endogenous construct, obtained via blindfolding (Geisser, 1974; Stone, 1974); a value above zero indicates real predictive relevance.
- VIF (Variance Inflation Factor)
- A collinearity diagnostic; a high VIF among a construct's predictors (or, in Kock's 2015 full-collinearity test, across the whole model) indicates redundant predictors and can also flag common method bias.
Appendix B — Analysis-to-Section Quick Reference
| Calculate menu item | Guide section |
|---|---|
| PLS-SEM Algorithm | Section 6 |
| Consistent PLS-SEM Bootstrapping (PLSc) | Section 7 |
| CB-SEM | Section 8 |
| GSCA | Section 9 |
| Bootstrapping | Section 12 |
| Blindfolding / PLSpredict / CVPAT | Section 13 |
| Mediation | Section 14 |
| Moderation / Moderated Mediation / Quadratic Effect | Section 15 |
| Gaussian Copula (Endogeneity) | Section 16 |
| MGA / MICOM | Section 17 |
| FIMIX-PLS / PLS-POS | Section 18 |
| IPMA | Section 19 |
| NCA | Section 20 |
| Regression / Logistic Regression | Section 21 |
| PCA | Section 22 |
| Sample Size & Power Analysis | Section 23 |
Questions about a specific analysis not fully answered here can be sent through the Contact page. See also the shorter, task-oriented Docs section for quick how-to answers.