
Statistical Analysis Software
ResearchPLS
Advanced Statistical Analysis for Modern Research
Prepare data, build statistical models, run advanced analyses, visualize results, interpret findings, and generate professional reports — all inside one integrated research workspace.
7-day free trial, once per customer · No credit card required to start
Illustrative demo model
How it works
One integrated research workflow
ResearchPLS isn't a collection of disconnected statistical tests -- every stage of a study lives in the same project, end to end. Scroll to see how a research question becomes a defensible result.
Stage 1
Start with a research question.
Every analysis begins with a question worth asking. ResearchPLS turns it into a model you can actually test.
Stage 2 — Model
Build your conceptual model.
Constructs, indicators, and structural paths -- drawn the way you'd sketch it on a whiteboard, backed by a real DAG.
Stage 3 — Measure
Validate your constructs.
Outer loadings, Cronbach's alpha, composite reliability, AVE, HTMT -- before you trust a structural result, trust the measurement behind it.
Cronbach's α (SAT)
0.850
Composite Reliability
0.900
AVE
0.740
HTMT (SAT ↔ CI)
0.610
Stage 4 — Analyze
Estimate structural relationships.
Path coefficients, t-values, p-values, R², f² -- the relationships that matter become visually clear, the ones that don't stay quiet.
PU → SAT
β = 0.421
PEU → SAT
β = 0.318
SAT → CI
β = 0.544
R² (Continuance Intention)
0.296
Stage 5 — Validate
Test the stability of your findings.
Bootstrap resampling turns a single estimate into a distribution -- confidence intervals and significance you can defend.
Bootstrap resamples
5,000
SAT → CI, 95% CI
[0.44, 0.64]
Significant paths
3 of 3
Stage 6 — Report
Turn statistical evidence into clear research results.
One coherent story, from question to defensible result -- ready for a thesis, a paper, or a professional report.
The actual software
This is ResearchPLS -- not a mockup
Every screen below is a real capture of the ResearchPLS desktop application, shown with an illustrative demo project.
Build the structural model on a real canvas: drag constructs, attach indicators, draw paths.
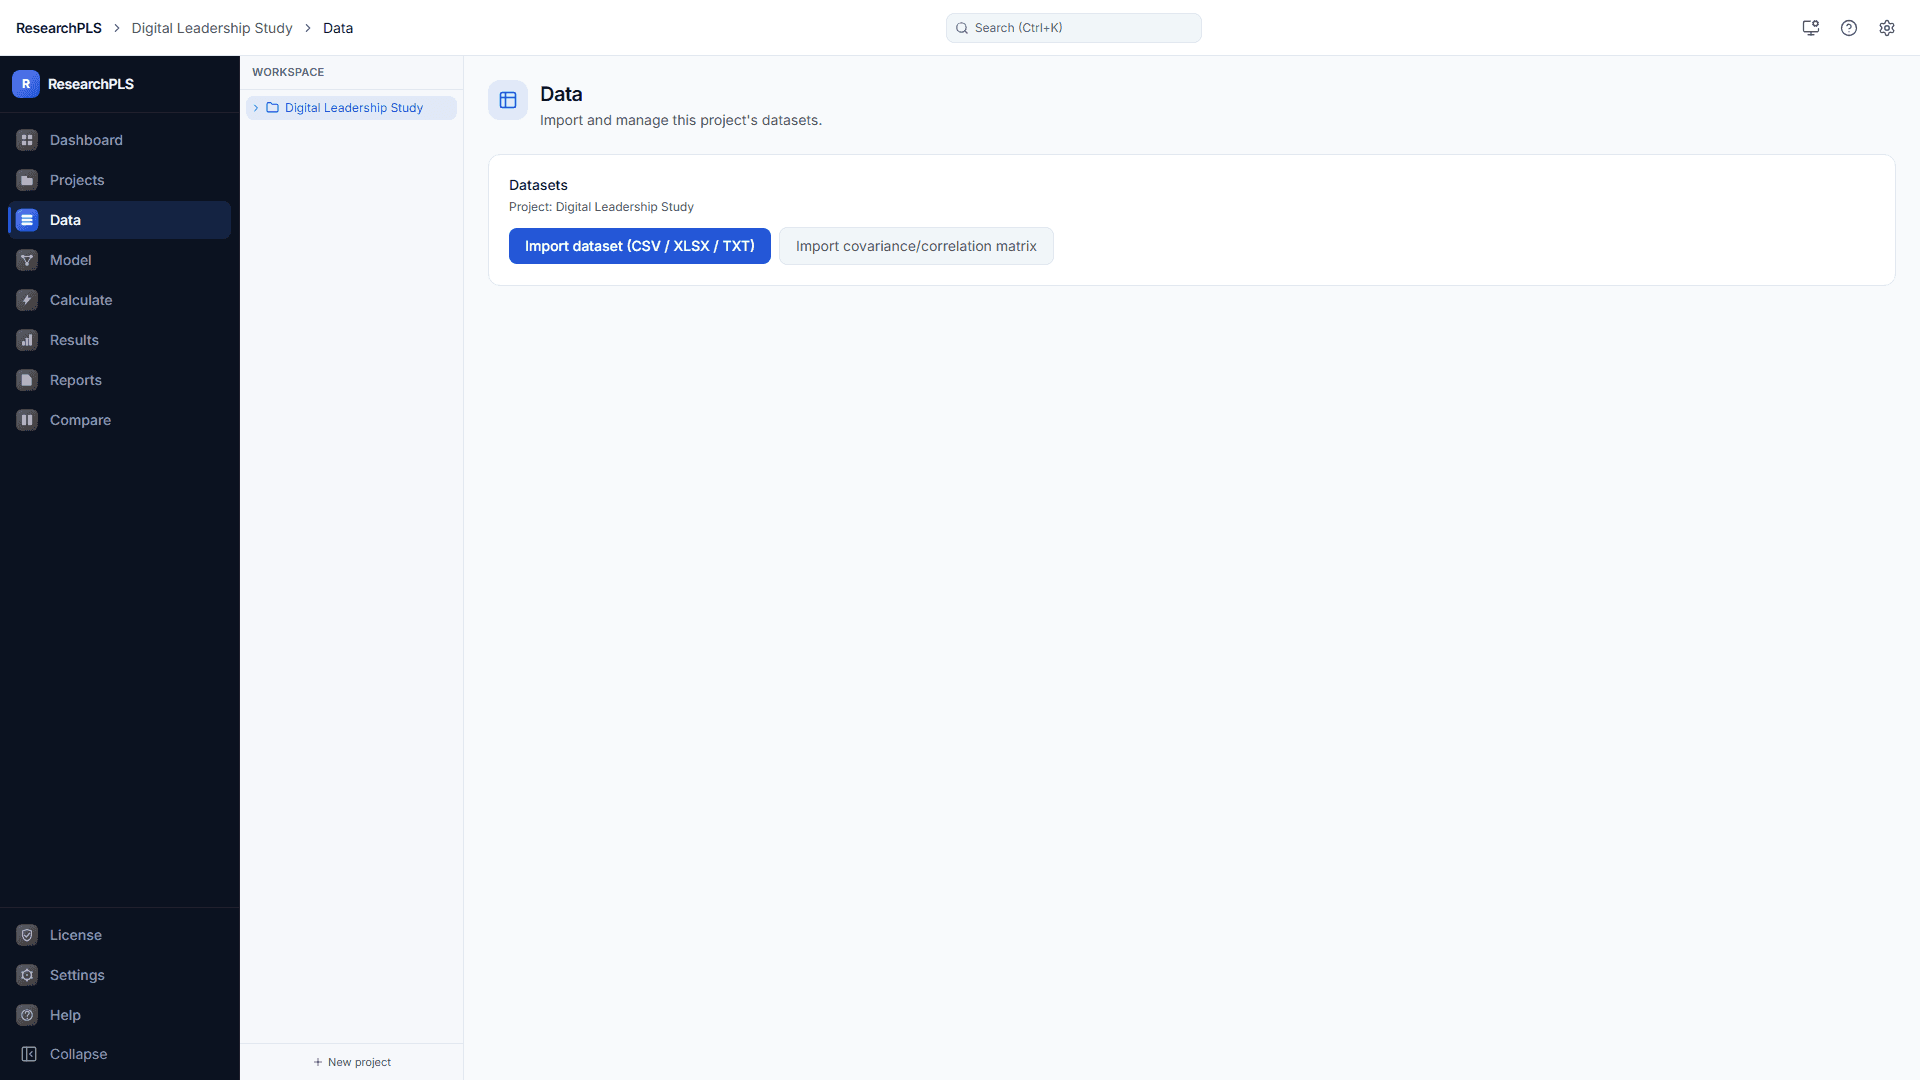
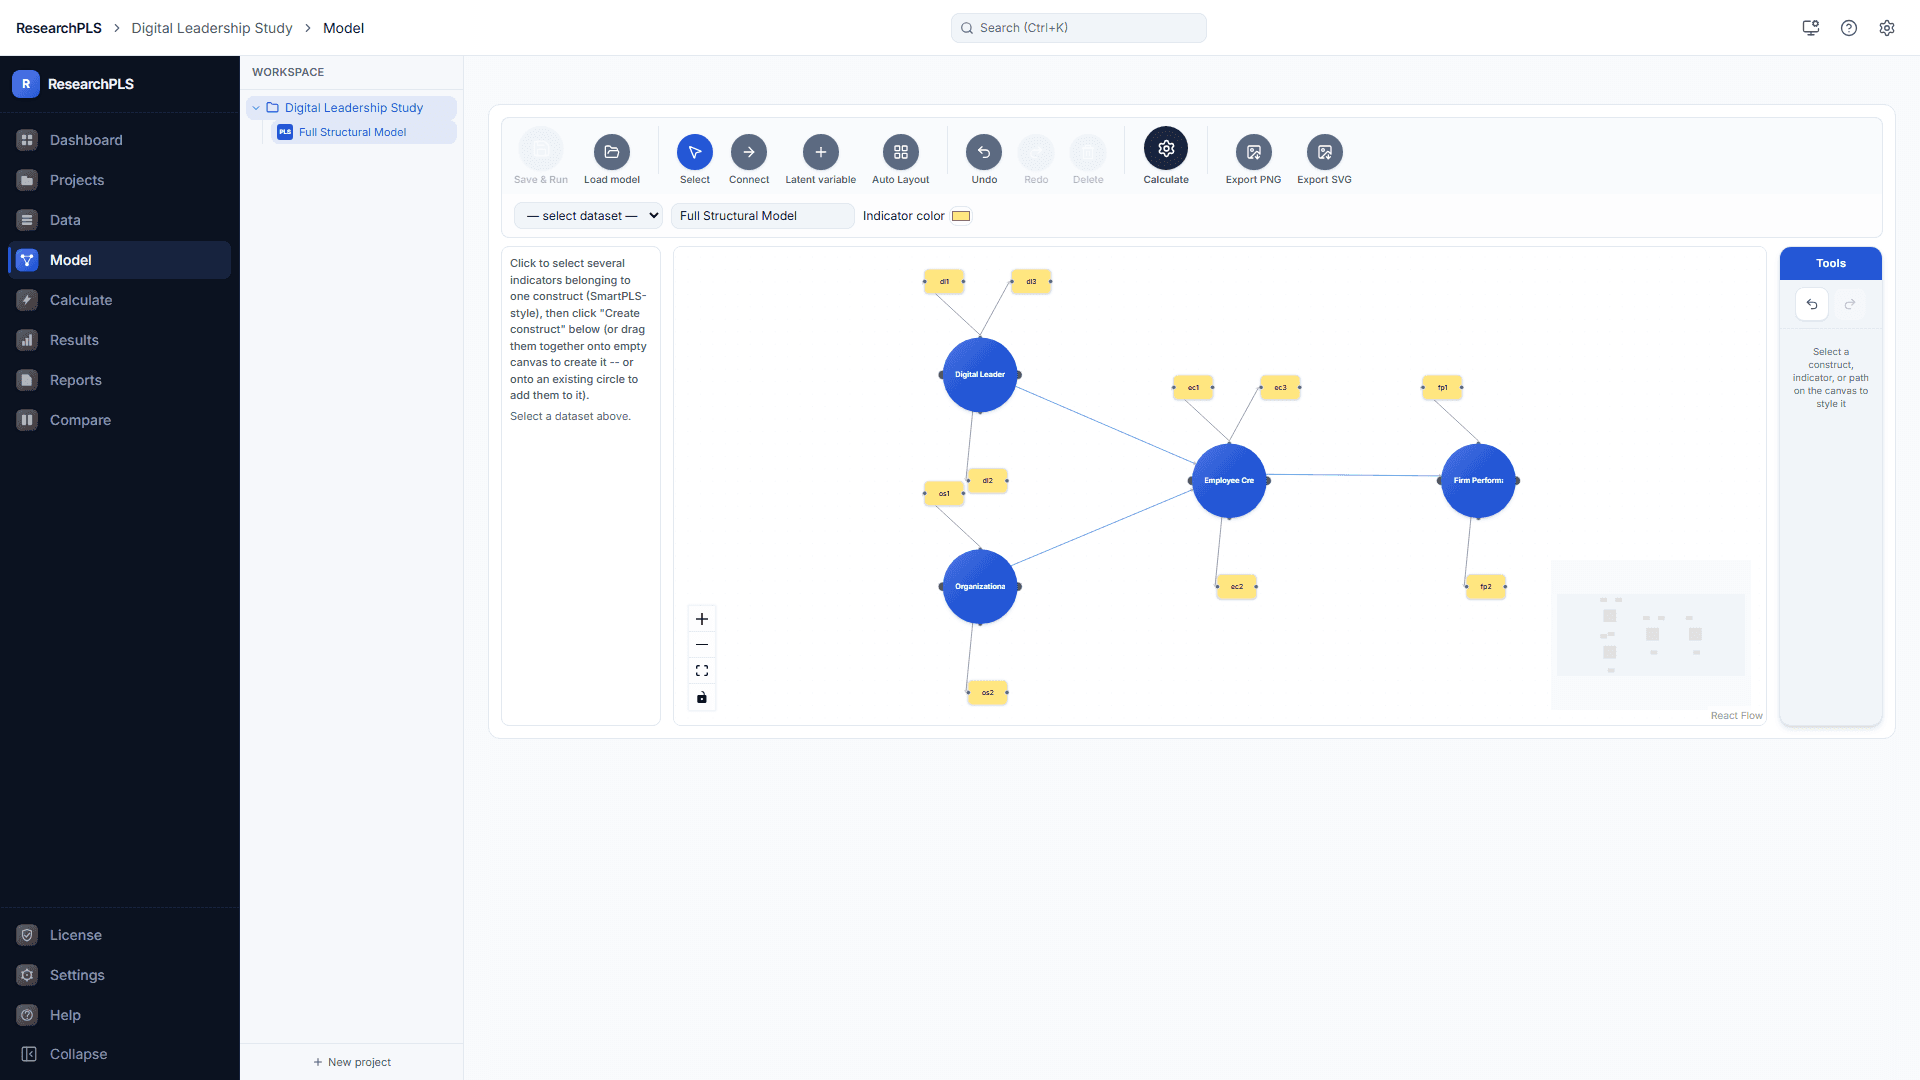
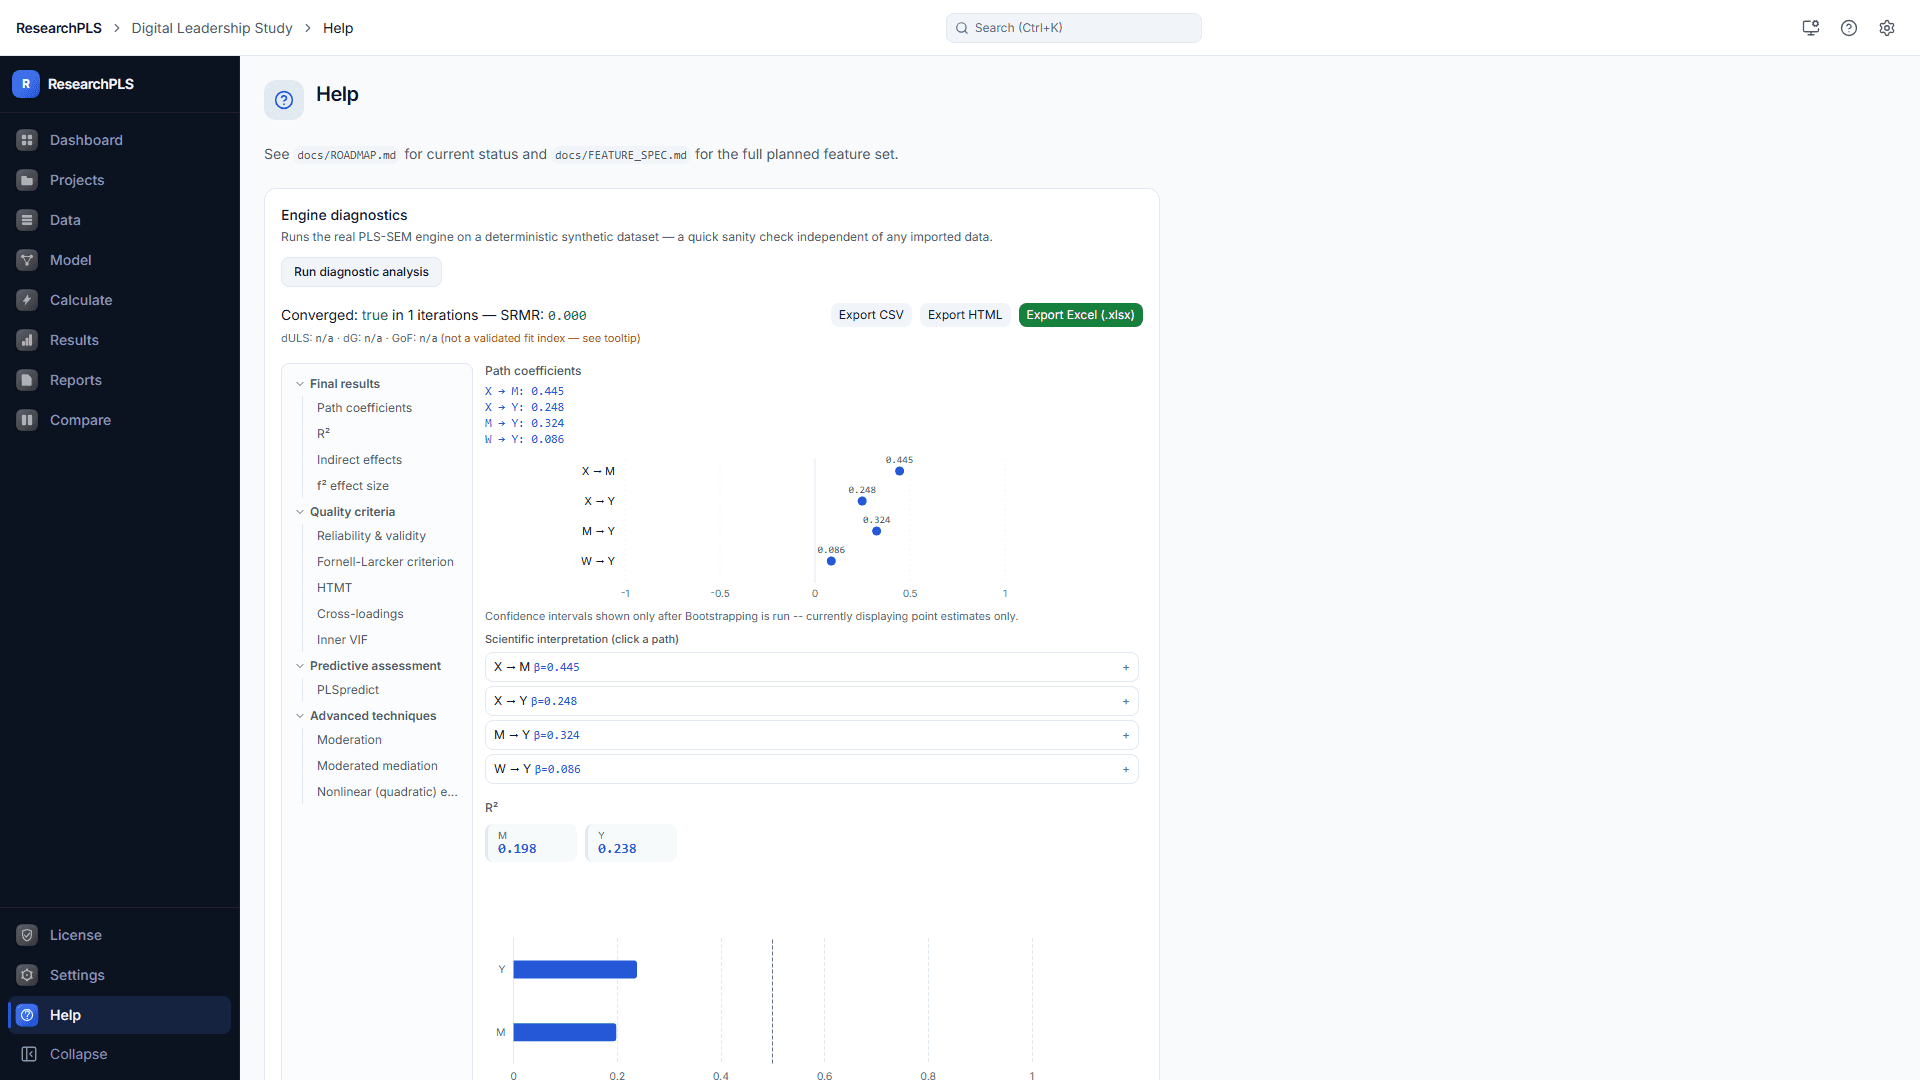
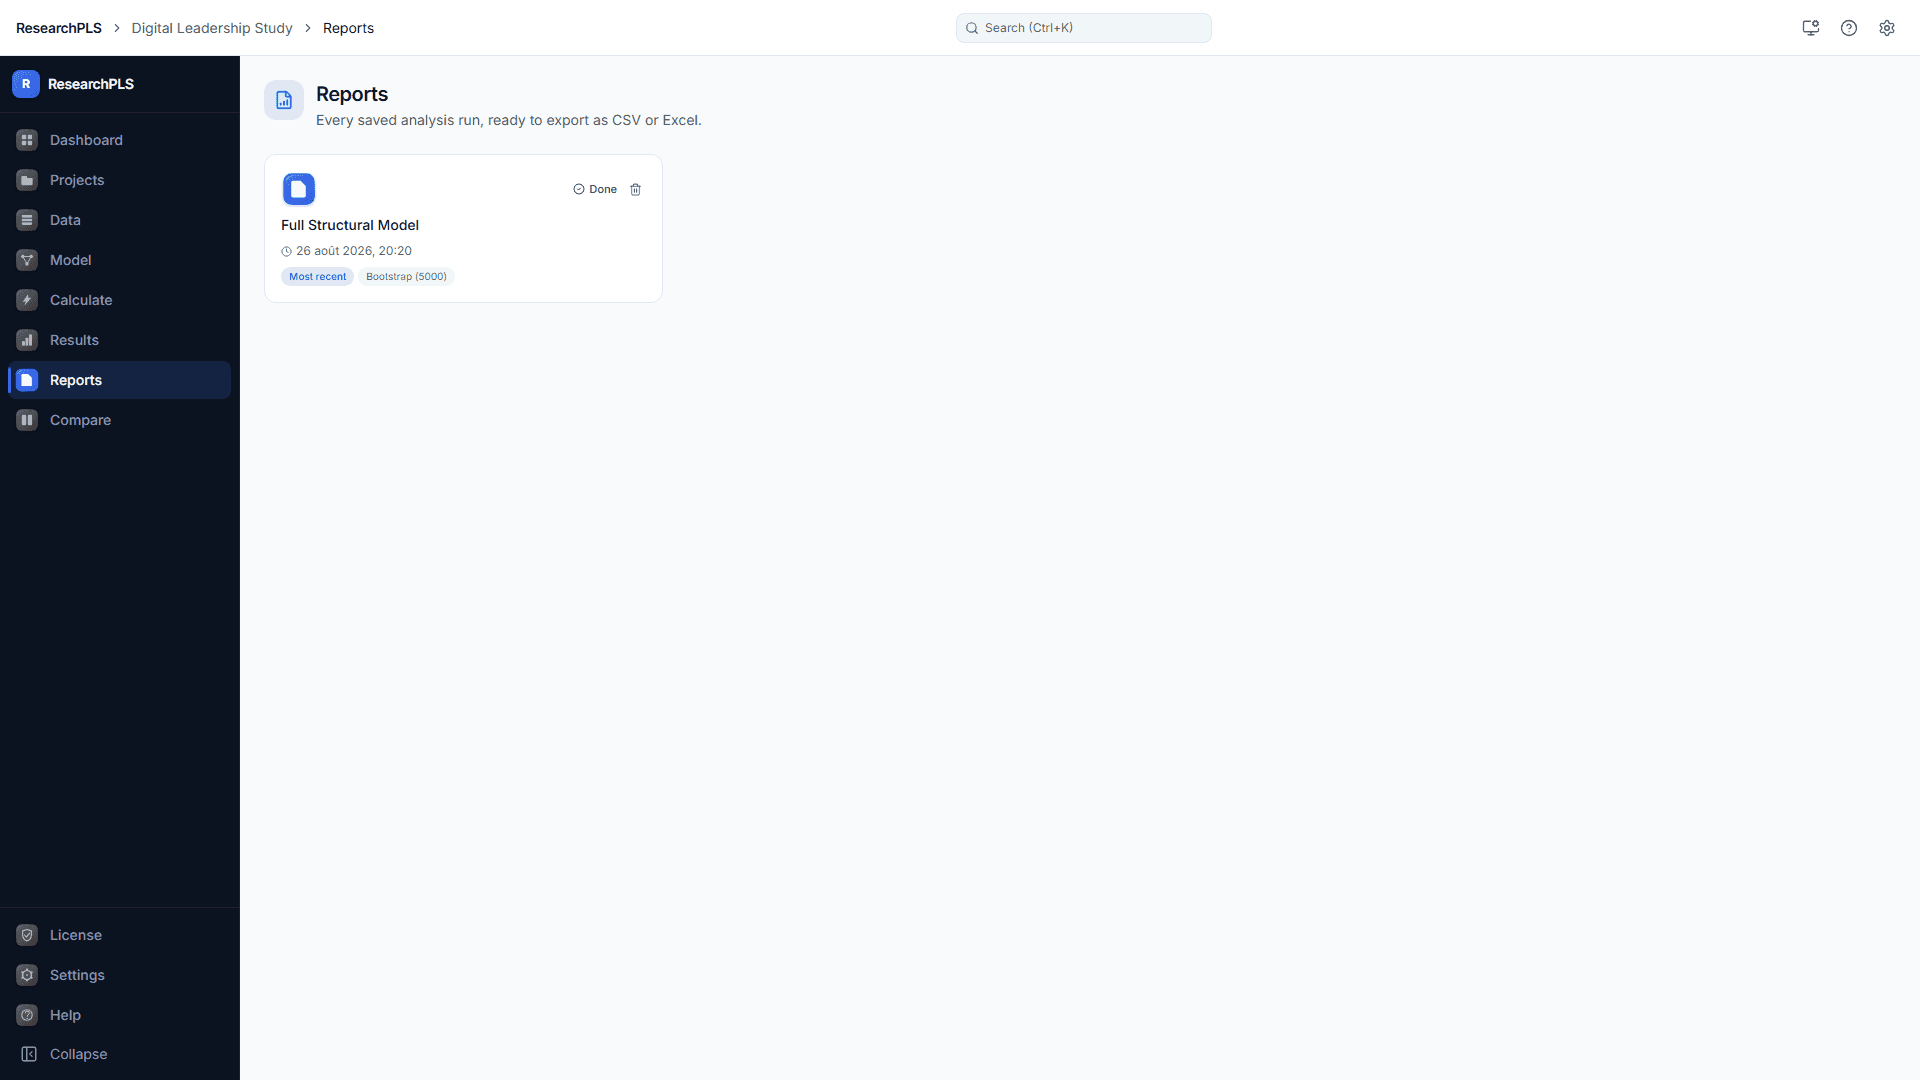
Real ResearchPLS interface. Construct/indicator layout is an illustrative demo model, not a real study.
Capabilities
Built for serious statistical work
From composite-based PLS-SEM to covariance-based CB-SEM, applied regression, and prediction diagnostics.
SEM & Modeling
Build and estimate structural equation models with more than one estimation approach.
- PLS-SEM (partial least squares structural equation modeling), Mode A & Mode B
- CB-SEM (covariance-based SEM, including confirmatory factor analysis)
- GSCA (Generalized Structured Component Analysis)
Statistical Analysis
The applied statistics researchers reach for alongside a structural model.
- Multiple linear regression, with bootstrapping
- Logistic regression for binary outcomes
- Mediation analysis (bootstrap-based indirect effects)
Prediction & Advanced Analysis
Assessment beyond a single model fit -- prediction, comparison, and heterogeneity.
- Bootstrapping for significance testing across every analysis
- Model comparison and prediction-oriented model selection
- Multigroup Analysis (MGA)
Results & Reporting
Every analysis produces real, exportable output -- not just an on-screen number.
- Full statistical result tables (loadings, weights, path coefficients, R², f², SRMR, and more)
- Publication-quality charts for every result
- Guided statistical interpretation alongside each result
Results & reporting
Publication-quality output, every run
Every analysis produces full statistical tables, matching charts, and a plain-language interpretation -- then exports cleanly to Excel or a self-contained HTML report.
- Full result tables for every analysis
- Charts generated from the same computation as the numbers
- Excel workbook & HTML report export
- Model diagrams exportable as PNG or SVG
Illustrative ResearchPLS demo model
Perceived Usefulness + Perceived Ease of Use → User Satisfaction → Continuance Intention
SAT — R² (adj.)
0.457 (0.454)
CI — R² (adj.)
0.296 (0.294)
| Path | β | t | p | 95% CI | Significant |
|---|---|---|---|---|---|
| Perceived Usefulness → User Satisfaction | 0.421 | 6.12 | < 0.001 | [0.311, 0.521] | Yes |
| Perceived Ease of Use → User Satisfaction | 0.318 | 4.47 | 0.0021 | [0.208, 0.418] | Yes |
| User Satisfaction → Continuance Intention | 0.544 | 8.03 | < 0.001 | [0.434, 0.644] | Yes |
Scientific interpretation (click a path)
Simple pricing
€69.99 / year
One plan. Every professional capability. 1 user, 1 active device. Start with a 7-day free trial -- no card required.